
Introduction
The electricity network is changing. Forecast load growth is minor, and the corporate and regulatory landscape is turbulent resulting in tight budgets. Ever increasing penetration of distributed energy resources and gradual closure of large synchronous generation is resulting in unexpected peak loading and system stability difficulties for network operators. On the other hand, technology is advancing at a tremendous rate with advanced condition monitoring coming of age and acceptance, and novel energy storage and control schemes being introduced into the system.
One way this challenge is being met is by utilizing modern continuous monitoring and modelling technology to re-rate existing assets above their original specified nameplate rating. Deferring or negating significant capital cost on the basis of proven systems with empirical data is a business case that is more readily gaining acceptance. Coupled with an online condition monitoring strategy to assist these assets through their later years of life – perhaps at higher loading than ever experienced before – utilities are breathing new life into their network and overcoming these difficulties deferring asset reinforcement.
With the changing face of the electricity market, we are all experiencing the new renewable energy technologies, the dispersal of generation, and introduction of energy storage systems with new challenges being confronted.
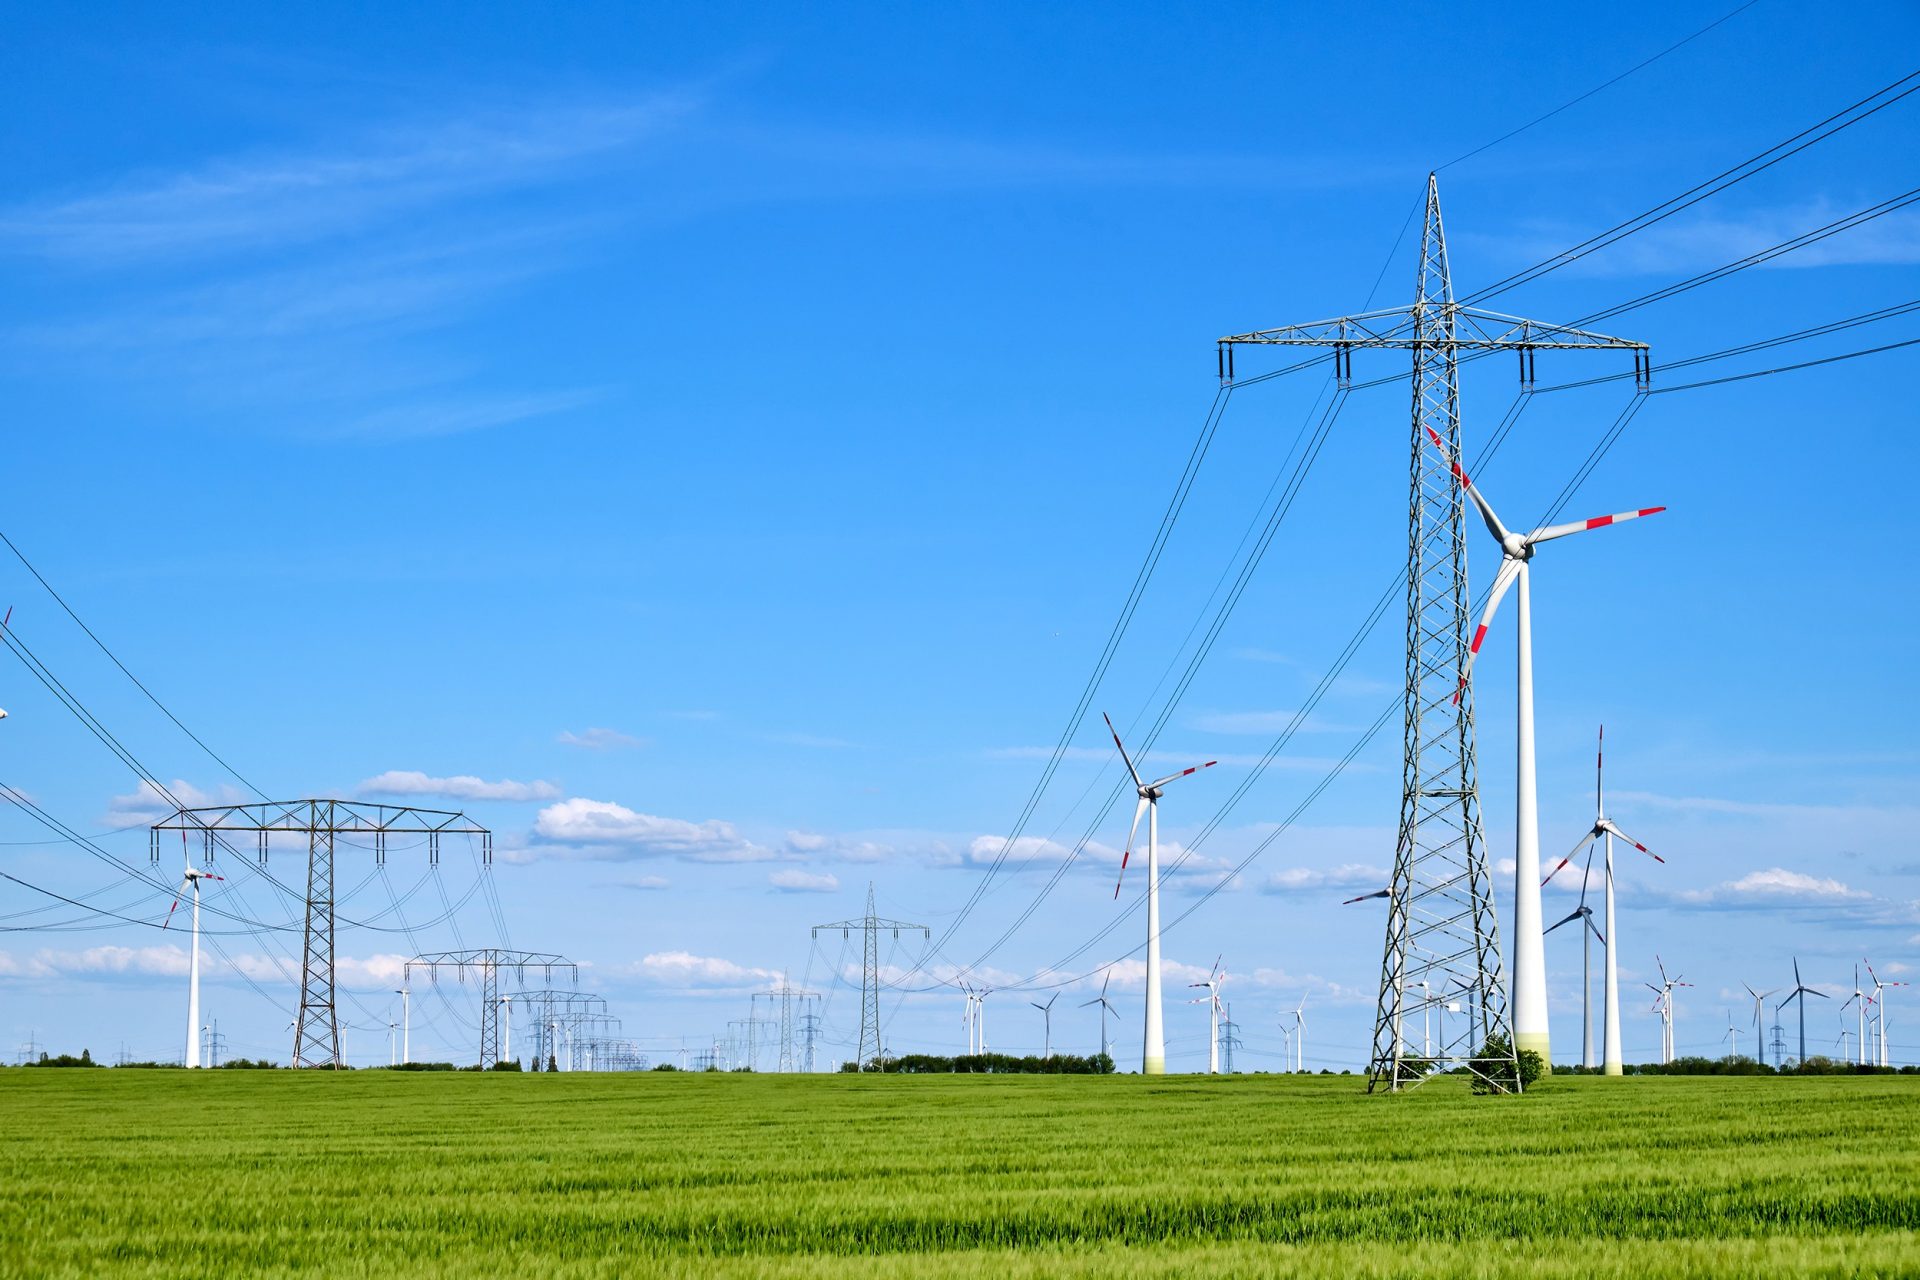
ElectraNet, the transmission network owner and operator for South Australia, is facing these challenges as much as anybody else, possibly more given the high levels of both large scale wind generation and domestic solar PV penetration and the closure of several large synchronous generating stations in South Australia. This is putting a higher reliance on the interstate transmission interconnector links, as well as the abilities of the network to handle distributed intermittent generation such as wind farms.
New technologies are being grasped to help transfer these new power flows and loading patterns, and considerable thought is being put into how the electricity network is going to be operated going forward. Concepts such as short term overloading of assets, as well as novel control schemes for generation dispatch and demand management are all becoming real options. It is safe to say that, nobody really knows what the electricity network of the future will look like, but we do know that it will need to be more flexible and adaptable to the changes that we are seeing today.
The Challenge
This project came about due to changes in the electricity network that are now occurring at an ever increasing rate. Introduction of intermittent and distributed energy sources such as solar PV and wind generation are changing power flows in ways that were not anticipated when the original systems were designed.
Due to lower connection costs, it is common in Australia for new wind farm projects to be economically connected onto the sub-transmission network, putting in place power flows that were not anticipated when the power system was originally designed. As such, some of the lower rated 132kV lines that feed around ElectraNet’s south east substation which are in parallel with the 275kV interconnector circuits between South Australia and Victoria, are now leading to constraints due to their new and increased utilization.
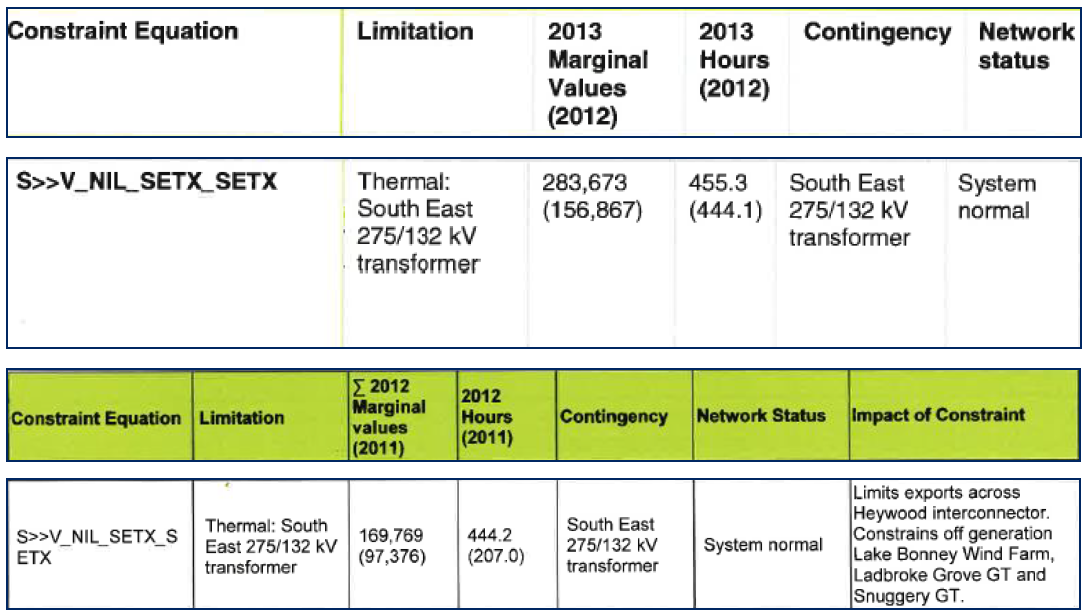
Figure 1: Excerpt from AEMO constraint report
The two south east substation (160MVA, 275/132kV) transformers soon became a limiting factor on electricity export to Victoria, particularly when wind generation on the 132kV network is high and power flows reversed from the 132kV to the 275kV systems. The thermal rating of the transformers at the south east substation was constraining power flow from South Australia to Victoria, as well as spilling the generation output of the connected wind farms. This placed the south east substation transformers thermal rating as one of the top ten network constraints in AEMO’s National Electricity Market constraint report, with marginal values in excess of $500,000 over the previous three years.
In 2012, the Heywood interconnector contingent project between South Australia and Victoria was being reviewed (RIT-T) for additional capacity options, and the reorganization of the 132kV network was considered under this project.
The thermal ratings of the south east transformers therefore had a potential impact on the export capacity of the interconnector, and needed to be addressed. The overall Heywood interconnector project looked at various options to improve the constraints for the interconnector that dealt with improving both the flows through the 132kV network as well as improving the capacity of the 275kV to 500kV network.
Nine [1] proposals were seriously considered, varying from construction of a whole new interconnector from Krongart to Heywood, through to various augmentation and reconfiguring options for the existing transmission assets in the southeast region. Installing additional primary plant such as new transformers comes at significant cost, particularly when the civil and associated works are included.
As such, a prolonged decision process was undertaken to ensure that the best investment was made and that it would not only be suitable to deal with the problems currently being faced, but to ensure that it would also be future proof and would not create any new problems, such as sub synchronous oscillations due to added series compensation.
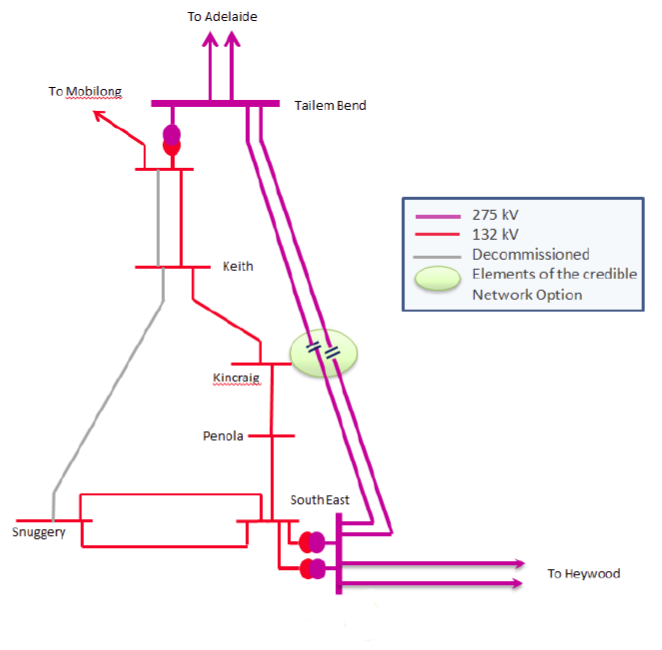
Figure 2: Single line diagram of south east region of South Australia after the Heywood project [1]
The Solution
After very careful modelling and consideration of the Net Market Benefits, the final solution (and now project in progress) is to: increase the capacity of the Heywood interconnector by installing another 275/500kV transformer at Heywood in Vic; install series compensation on the 275kV TB-SE lines in SA to increase capacity; and reconfigure the SA 132kV network to reduce bottlenecks. With respect to the reconfiguring of the 132kV network, the thermal rating of the transformers at south east substation still remained a major constraint.
After discussions within ElectraNet and with Dynamic Ratings, it was determined that it would be possible to introduce a novel control scheme and monitoring system in order to accurately calculate the dynamic thermal rating for these parallel transformers, and determine a new substation rating. From a security of supply point of view, it was important that the substation load did not exceed the N-1 rating of the installed transformers, so a maximum thermal rating for each transformer needed to be calculated, as well as determining the time limits imposed on the parallel transformers in contingency situations. ElectraNet chose to work with Dynamic Ratings for this unique part of the overall interconnector upgrade project.
Thermal Modeling and Predictive Loading
ElectraNet required a revised N-1 substation rating for both an extended period of time, continuous rating, as well as for various short durations, 15, 30 and 60 minutes, while the generation was being re-dispatched elsewhere on the network. ElectraNet was primarily interested in the 15 minute rating in the future, which is the shortest time period and highest rating AEMO can re-dispatch upon and the basis of the LDSH rating. The N-1 rating is defined as the maximum load that can be supplied in the first credible contingency situation – that is, when one transformer is taken out of service or tripped. At any given time, the N-1 rating is constrained by the ‘weakest link’ or the transformer with the lower rating. Whilst the transformer rating is generally very stable and only really dependent on the ambient temperature (an important consideration given Australia’s high ambient temperature), it is also dependent on the health of the cooling system, so it was important that the thermal rating took this into consideration when providing real-time values.
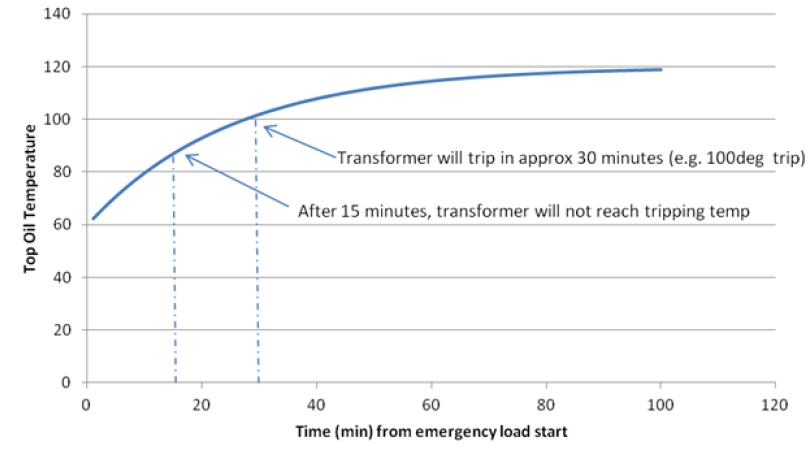
Figure 3: Example temperature curve showing profile after step load
The provided transformer management system had the capabilities to perform this real-time thermal modeling and calculate a dynamic thermal rating for each transformer while providing two unique types of predictive calculations. These predictive calculations are known as ‘what if’ calculations, and are in the form of ‘time for load’ and ‘load for time’ and are calculated by extrapolating the calculated temperatures given certain starting conditions which could be the current state, or some other contingent state. These calculations are shown graphically in Figure 3.
The time for load calculation determines the time until thermal limits are exceeded at a given load and operating conditions. For instance, how long it will take for the transformer to exceed the thermal protection limit if it is subjected to 130% overload on a hot day.
The load for time calculation works in reverse, and calculates the maximum loading capability for a set duration of time without exceeding thermal limits. For instance, how much a transformer can be overloaded without exceeding the thermal protection limits for a two-hour period.
Further, the transformer management system was able to use the continuously calculated predicted transformer temperatures to control the cooling system. This allows a level of precooling – i.e. identifying when the transformer is going to get hot, and bringing the cooling in long before in order to mitigate the effect of the heating. This in turn keeps the average temperature of the transformer down, and helps extend the life of the unit.
To gain a better understanding of the parallel loading of the transformers and how each would react thermally if the other were to trip, a communications link was supplied between the two transformer management systems to share the transformer loading information. This could have been accomplished with a summation CT. However, being able to perform this summation numerically allows for future situations with more than two transformers and varying contingency situations. It also removes the need to run CT wiring around the substation which has an inherent risk involved from potential open circuit incidents.
The transformer management systems were then configured to calculate, for each transformer independently:
- Maximum continuous rating in MVA
- Time with current loading until thermal limits exceeded
- Time with total substation load until thermal limits exceeded
- Maximum rating in MVA for 15, 30 and 60-minute loading intervals
All of these results were calculated continuously, in real time, with real time operating conditions. For instance, if a cooling bank was taken out of service for maintenance, the maximum continuous MVA value would decrease by the respective amount. The data was made available to the control room over the SCADA connection, and also logged at one minute intervals for future data review, accessible via remote connection by the asset performance team engineers. An example of this data output in web page format is shown in Figure 4.
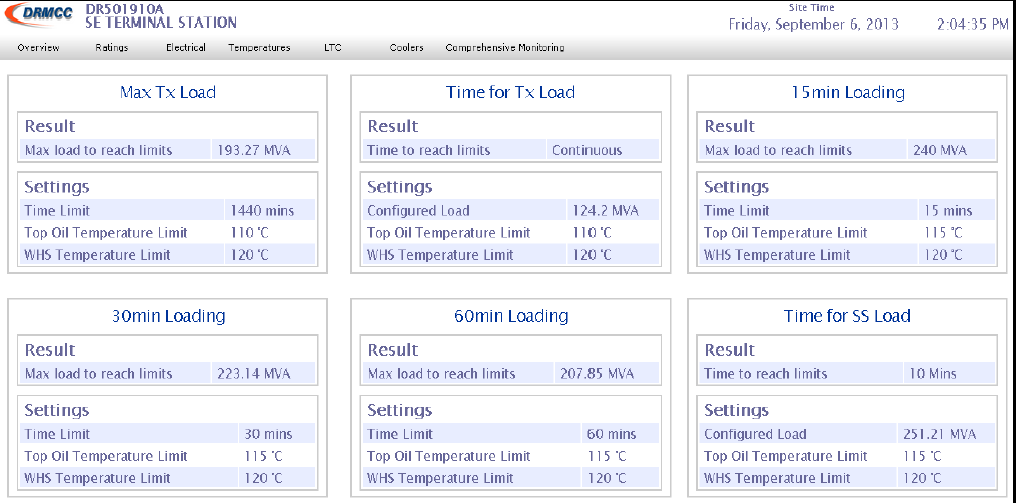
Figure 4: Sample data output from site showing Dynamic Rating calculations
Software and Model Upgrade
At the time of the project, the majority of available electronic temperature monitoring systems for transformers calculated temperatures based on the IEC60354 standard. In 2005, the standard was revised as IEC60076 and included several important enhancements that were key to this type of project. The major change to the winding temperature calculation was the inclusion of several scaling functions that took into account the better understanding of heating around the windings on oil directed transformers when the oil pumps are not running, and the time required for enough thermal differential to develop across the coolers to create the pressure to start the oil moving through the windings. [2]
Given that this was going to be a possible scenario on the project (i.e. both transformers running relatively cool at 50% loading, then one unit tripping and the load being transferred to one unit), a project was undertaken to completely revise the thermal model implementation in the transformer monitoring system. After the update, thorough verification and testing was completed to ensure that the model was working as expected.
Comprehensive Monitoring
When planning to operate an asset (particularly an older one) above nameplate rating, there are risks involved. These include accelerated ageing of the asset as well as increased chance of fault due to components working at elevated stress levels. For critical assets, this risk is exacerbated due to the consequences of an outage or failure on the network and steps must be taken to manage these risks.
For this project, comprehensive online condition monitoring was included in the scope to allow the transformers to be closely monitored to evaluate the impact of overloaded operation, and to ensure that any incipient faults that could impact the security of supply were detected early.
Finally, for mission critical transformers, taking outages for offline testing and maintenance is very difficult and can limit network operation. The use of comprehensive online condition-based monitoring gives the capability of extended testing and maintenance windows, only taking outages when absolutely necessary. Having a greater understanding of the condition of an asset allows better planning and scheduling for outages and site works which can save money and reduce risk.
On the transformers in question, the selected online condition monitoring include:
- Comprehensive thermal monitoring
- Insulation paper ageing
- Integrations of existing online key gas monitoring
- Bushing health monitoring
- Transformer partial discharge monitoring
- Tap changer temperature differential and motor energy monitoring.
This selection of monitoring covers the majority of items that pose potential risk of transformer failure and dramatically increases the chance of detecting incipient faults at the early stages.
Thermal Model Optimization
As with any modelling, the performance of a model is highly dependent upon the input data. Where the input data comprises of measurements, the measurements must be made with suitable accuracy and resolution. When the input data comprises of constants, characteristics, or parameters then these must be as representative as possible.
For the thermal modeling of power transformers, there are a number of parameters that must be set for the model to work, such as the top oil rise at rated load, thermal time constants for heating and cooling, and so forth. Typically most of this data can be gleaned from the transformer test report, and most transformers undergo a heat rise test during factory acceptance. However these heat rise tests are performed under certain standard conditions, and are usually not representative of normal operating conditions on site, and the remaining parameters are taken as default values from the IEC standard. Some of these values cannot be applied broadly across all transformers, for example, some auto transformers have lower core mass and have different time constants.
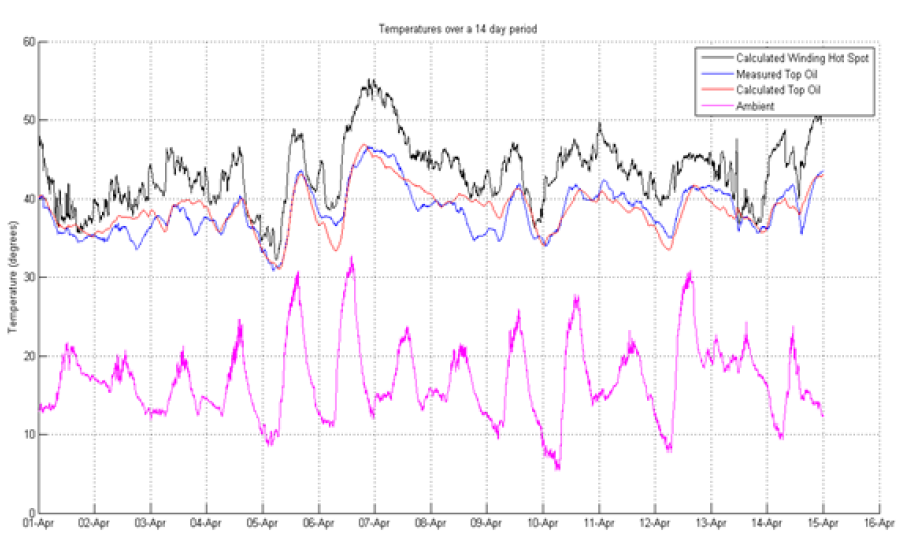
Figure 5: Data recorded from site over a two week period
Furthermore, the quality of the testing and reporting for older transformers and the existence of the original test reports can pose some difficulties that need to be surmounted. This was a problem that was experienced for one of the transformers on site, where the transformer had been relocated over its life, and much of the original test documentation was very difficult to locate.
These difficulties necessitate a process optimization of the model. This is performed by collecting a period of site data from the transformers (measurements), and performing a parametric optimization using a regression technique. Whilst computationally intensive, this generally yields a set of parameters for the model allowing far more accurate calculation of the real-time temperatures for the transformer, providing more confidence to the predicted temperatures in the emergency loading situations. This was performed for this project, and the results of the optimization were sufficient that the model was able to accurately calculate the transformer temperatures to a level that gave the needed confidence to use the modelling system as intended.
The Results
After the system had been operating for a year to allow for all seasons and in particular summer, the data was retrieved and analyzed by ElectraNet. The data showed the transformers were indeed capable of being rated higher, both continuously and for short periods of time. The results showed that due to the benign temperature conditions (typically cool and wet with high wind corresponding to high loading) and the large thermal mass of the transformer that there was significant extra headroom available.
As such, ElectraNet chose to re-rate the nameplate of the 160 MVA transformers with a new AEMO “LDSH” (Load Shed, 15 minute) equipment rating of 208 MVA. This is equivalent to the upper limit of 1.3x nameplate or long term emergency cyclic loading in IEC 60076-7 for large power transformers. It allows greater throughput and increases the export capacity for the generation connected on the 132kV network before network constraints come into play. This has the outcome of increasing the pre-contingent N loading of the transformers from 80 to 104 MVA. However, under planned outage of one of the transformers a rating of 160 MVA remains.
The ability to operate the transformers up to this point reduces the network constraint imposed by AEMO, and the thermal constraint of these transformers is ‘out of the way. This, combined with the other, larger, aspects of the interconnector project will increase the security of supply of the NEM, particularly to South Australia as further synchronous generation is decommissioned.
It may well have been possible to reach a similar static result with an offline desktop cyclic rating calculation. As this was predominately an intermittent wind generation problem rather than the better understood and relatively simple residential, commercial, or industrial peak load profile, ElectraNet didn’t really have confidence on what load profile to use to determine this. Missing from the older transformer was a factory heat run test result further reducing confidence. For these reasons we were keen to trial an online device but using it in an offline information gathering way with the potential to use in Dynamic Ratings later if required. The value add of having the condition-based monitoring functionality on aged transformers that are also being pushed harder in their old age added to the reasoning on using this product.
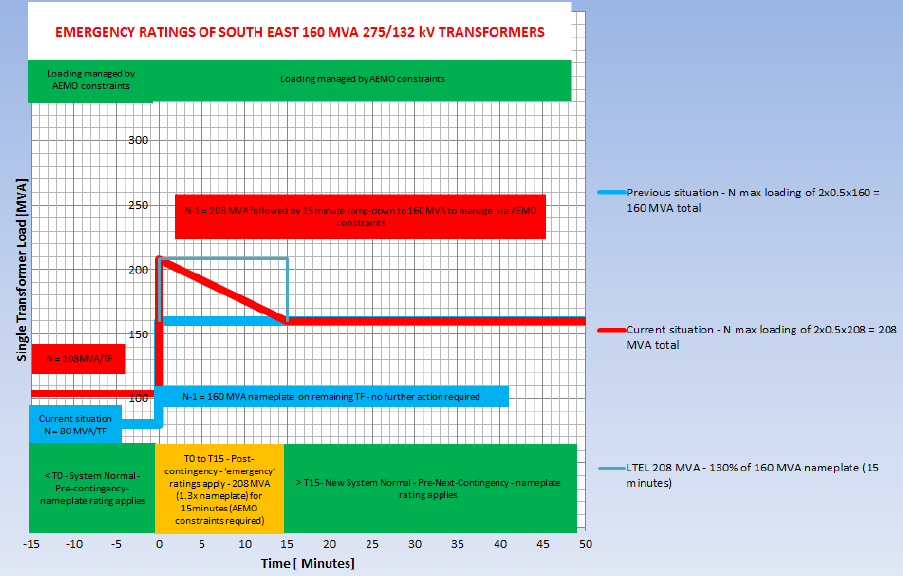
Figure 6: Emergency ratings of south east transformers
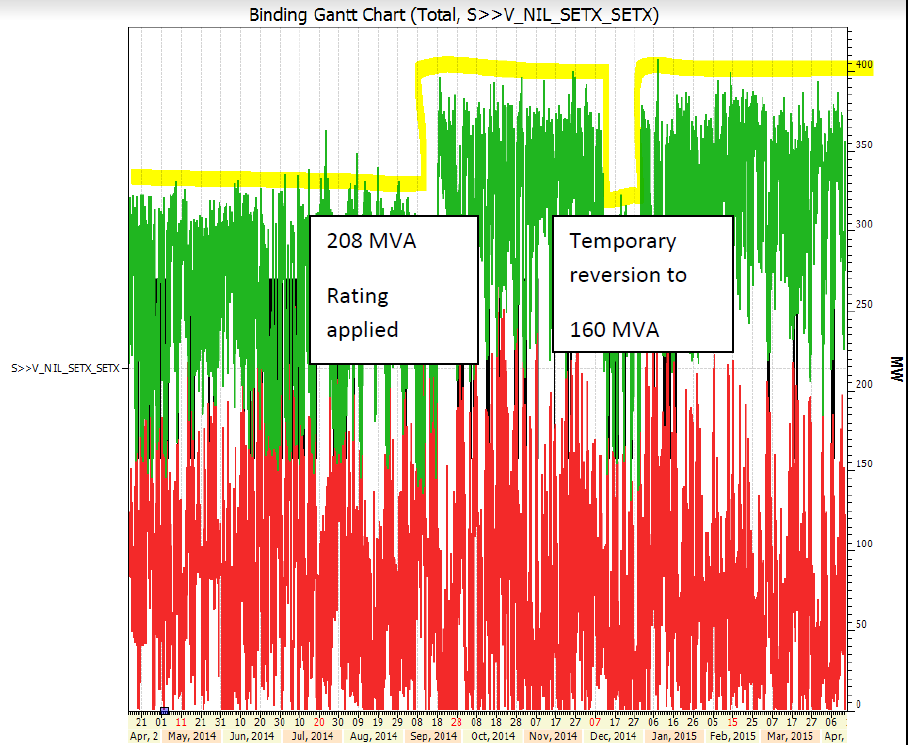
Figure 7: Heywood interconnector MW Import and Exporting binding constraint level
Application of this type of technology to transformers, and potentially other assets will surely become more common in the near future with the changing nature of the electricity network. As the electricity network continues to evolve and generation moves from large centralized units to that of a distributed and intermittent nature the need to better understand the capabilities of transmission and distribution assets, possibly in real time, is growing.
In this case, the technology has not been applied in real time, however being able to re-rate the assets for AEMO with a high degree of confidence found from a proven system operating over a long period has still allowed significant benefit to ElectraNet and the market. In the future, if more wind generation locates itself in the south east 132kV region and the thermal constraint again rears its head, ElectraNet would look towards apply that rating in real time. This, coupled with the rest of the network augmentation and upgrade project, the interconnection between South Australia and the rest of the NEM looks to be strong and secure for years to come.
The E3 Transformer Monitor provides real-time thermal modeling, predictive loading calculations, and comprehensive condition monitoring to help utilities safely get more capacity from their existing transformers. To learn more, visit www.dynamicratings.com/products/e3-transformer-monitor/.