
What is Online Bushing Monitoring?
Bushing monitoring continuously evaluates the condition of transformer bushings during all weather conditions, loads, and rated voltage.
Bushing monitoring helps provide data so that engineers can make smart, critical decisions about their transformers. CIGRE surveys attribute roughly 14–17% of major transformer failures to bushings, rising above 20% for units rated 300 kV and up (CIGRE TB 755). Nearly half of bushing-related transformer failures have severe consequences such as fire or explosion, and bushings are the most common cause of transformer fires (CIGRE TB 755).
Offline tests are performed on a routine schedule – maybe once every few years. Yet many failure mechanisms on bushings occur in a very short period of time measured in days to weeks. Additionally, some failures are temperature and voltage-dependent that are difficult to simulate during offline tests.
Online bushing monitoring overcomes these offline test limitations by continuously monitoring the bushings which increases performance and reliability of the transformer. Learn more about online bushing monitoring methods and case studies in this white paper.
Read White Paper
White paper: On-line bushing monitoring methods and case studies
By Claude Kane and Dr. Alexander Golubev, Dynamic Ratings. Presented at the PdMSA Conference, .
Off-line bushing tests are run at about 10 kV and ambient temperature, often years apart, which can give a false sense of security. Many bushing failure mechanisms develop in days to weeks, and some only appear at operating voltage and temperature. This paper explains how the sum-of-currents method monitors bushings continuously, how bushing sensors must be protected, and what two field cases revealed.
How the sum-of-currents method works
The monitor takes the leakage current from the test taps of a three-phase set of bushings and adds them as vectors. At commissioning, a balancing circuit nulls the sum to zero to account for normal differences between bushings and phase voltages. When a defect changes one bushing’s capacitance or power factor, the sum moves away from zero. The size of the change indicates severity, and its phase angle shows which bushing is affected. Alarm points are typically set at 2 to 3% of the sum-of-currents value, with critical alarms at 5%.
Asymmetric changes in system voltage can mimic a bushing change. A magnitude change can look like a capacitance change, and a phase shift can look like a power factor change. Symmetric voltage changes cancel out. The paper describes limiting these effects with statistical processing and correlation with load current.
Why bushing sensor protection matters
- An open-circuited test tap can rise to as much as half of the phase-to-ground voltage, because C1 and C2 act as a capacitive divider. This overstresses C2, causes sparking that contaminates the oil, and can lead to full breakdown of the main C1 insulation.
- The sensor described limits tap voltage to 18 to 20 V rms using four voltage limiters, twice the number needed for normal operation.
- Surge protection is designed to withstand up to fifty full BIL impulses. Some resistive tap loads limit voltage at power frequency but pass fast switching or lightning surges almost entirely to the C2 insulation.
- A fail-safe circuit shorts the test tap to ground if all other protection fails.
Temperature and voltage dependence in a defective bushing
A known-defective bushing was tested for about 200 hours under four conditions. At 25 °C and 10 kV, matching normal off-line test conditions, its power factor was stable and unremarkable. Power factor was higher at 70 °C and showed further voltage dependence at 70 kV. It was highest with both stresses applied together.
Case studies
- Peaking transformer bank: The monitor was installed on three single-phase transformers, each with bushings from a different manufacturer, at temperatures from 15 °C to 64 °C. A slight power factor rise on phase A matched dissolved gas analysis of that bushing’s oil, which showed low-level heating.
- 650 MVA generator step-up transformer: The monitor was installed in June 2005, and the transformer failed catastrophically in August 2005. The monitor had been sending magnitude alarms, and trend alarms were issued hours before the failure. The data showed severe temperature dependence and a rapid drop in phase A capacitance. The monitor was not connected to the plant’s control system, so the alarms went unseen.

What are the failure characteristics of bushings?
OIP Bushings
The integrity of the OIP (Oil Impregnated Paper) bushings is heavily dependent on the health of the gasket system, which is susceptible to damage from high temperatures. Gasket failures allow water ingress, and create self-sustained breakdown conditions from associated heating that are detected through online bushing monitoring. Defects in the bushing change the leakage current and phase angle(s), resulting in detectable current imbalance, tan delta (power factor) and capacitance changes.
RIP/RIS Bushings
RIP (Resin Impregnated Paper) and RIS (Resin Impregnated Synthetic) bushing constructions are more resistant to water ingress and explosive failure modes, but the propagation of partial discharge associated failures is much faster. The time for a RIP or RIS bushing to fail and cause an unplanned outage is far shorter than the typical periodic maintenance interval making continuous online bushing monitoring an ideal way to prevent failures.
Check out our white paper to learn more about the failure characteristics of OIP, RIP or RIS bushings.
Read White Paper
White paper: Failure characteristics of OIP vs. RIP bushings
By Mark Tostrud, PE, Technology Officer and Service Director, Dynamic Ratings. Published .
OIP and RIP bushings fail in different ways, so alarms from an on-line monitor need to be read differently for each. OIP bushings typically degrade through power factor and capacitance changes that can swing widely with temperature and may seem to clear on their own. RIP bushings rarely show power factor changes in service. They fail through permanent capacitance changes that can happen in under an hour, and partial discharge monitoring is the best way to catch them early.
Design and limits
- OIP bushings remain the most common type on new transformers because of their lower cost. They are typically rated for temperatures up to 105 °C. Higher temperatures, from loading or top terminal hot spots, can damage gaskets.
- RIP bushings use a paper core vacuum-impregnated with curable resin. Newer designs replace the oil envelope with foam or gel, or apply the silicone weather shed directly to the core. They are typically rated to 120 °C, and higher temperatures can cause irreversible damage to the condenser.
- IEEE limits for new bushings allow up to 10 pC of partial discharge for both types, and C1 power factor up to 0.50% for OIP and 0.85% for RIP. Most RIP bushings are designed to be partial discharge free up to twice their voltage rating.
- RIP bushings are considered more reliable, but their higher purchase price is a main reason utilities don’t specify them more often.
How OIP bushings fail
- Industry failure analyses find that about 80% of OIP bushing failures occur after 12 to 14 years in service.
- Power factor increases come from moisture, polar compounds from oil and gasket interaction, oil decay products, and partial discharge.
- Typical off-line guidance treats 1.5 to 2 times the nameplate power factor as a concern, but the rate of change is often a better severity indicator. Utilities often keep operating bushings at 2 to 3 times nameplate when the change is slow.
- A capacitance change of 5% or more usually prompts an evaluation of whether the bushing is fit for continued service.
- Off-line temperature correction factors are averages from large bushing populations, so they can be wrong for any single bushing. Tests are rarely done at elevated temperature.
- On-line data from a defective 69 kV OIP bushing with moderate moisture showed leakage current magnitude (capacitance) and angle (power factor) varying strongly with temperature. A partial discharge monitor installed at the customer’s request confirmed discharge activity in the main insulation.
- Not every defective OIP bushing is temperature dependent. Power factor increases with little temperature dependency usually point to minor contamination or early-stage partial discharge.
- Contamination from aging by-products along the inner lower porcelain can raise or lower power factor, depending on its pattern and location. It typically produces negative-polarity partial discharge. A 10 kV off-line test may not be enough to reveal it, so bushings that tested healthy can still fail. Partial discharge monitoring is the best way to detect it.
- OIP bushings can appear to “self-heal” when oil flow moves a defect elsewhere in the bushing. The improvement is usually short-lived, and the problem typically returns.
How RIP bushings fail
- Power factor increases in RIP bushings are mostly caused by moisture in the lower part of the condenser core, which has no envelope or shed to protect it. Manufacturer bulletins say these values should return to normal within a few hours of energization.
- Because RIP bushings contain no circulating oil, they don’t develop the non-moisture contamination or age-related power factor increases seen in OIP bushings. A power factor problem on an in-service RIP bushing would require the transformer oil itself to be very wet.
- Defects in RIP bushings stay localized, so any power factor change is small, hard to detect, and may come and go as a breakdown develops.
- Solid insulation is more sensitive to partial discharge and cannot regenerate the way oil-impregnated insulation can. Partial discharge may not show in power factor or capacitance until layers partly or fully break down.
- Once layers break down, the capacitance change is permanent and shows little temperature dependency. Manufacturer limits for capacitance change on RIP bushings are typically 3 to 5%.
RIP case studies
- 230 kV RIP bushing: An on-line monitor recorded no change in leakage current until the C1 capacitance suddenly rose 85% in less than one hour.
- Several manufacturers: Similar sudden failures have been detected in RIP bushings from several manufacturers, including one that failed as soon as a new transformer was energized.
- Off-line detection: A routine off-line test found an in-service RIP bushing’s C1 capacitance had risen 53%, from 625 pF at the 1998 factory test to 954 pF in 2008, while C1 power factor only rose from 0.43% to 0.52%. This shows capacitance is a better indicator of RIP deterioration than power factor.
- In these cases the bushings kept operating in a failed state without causing a transformer failure. However, some users have reported failed RIP bushings as the cause of catastrophic transformer failures.
Recommendations
- Don’t dismiss on-line alarms on OIP bushings as false because they later clear or don’t match off-line results until the data has been thoroughly analyzed. Consider testing at elevated temperature, and consult the monitor and test equipment manufacturers.
- Use partial discharge monitoring to detect inner porcelain contamination in OIP bushings, which can produce power factor changes that cancel out to zero.
- For RIP bushings, watch capacitance rather than power factor, and use either periodic off-line tests or continuous on-line monitoring. Industry studies and RIP manufacturers recommend partial discharge monitoring to catch failures in their earliest stage.

How Do Offline Tests Compare to Online Bushing Monitoring?
Both offline bushing tests and online bushing monitoring are important to evaluate bushing health. However, there are times when the data from offline tests and online monitors may not match. This is because of several reasons. Typically, offline testing is performed near ambient temperature with a test voltage of 10kV. This is not a true representation of the bushing’s normal operating conditions or stresses. Failure modes are easier to detect online while the transformer is energized at operating voltage and temperature.
Online monitoring detects incipient faults that are not detected by offline tests. A fault’s development time is typically less than the time between offline test cycles. Online systems measure the performance of the bushing at full operating voltage and temperature. Since the “test” parameters are different, the results may be different.
To learn more about why the data may not match, read our white paper on Online Monitoring vs. Offline Testing.
Read White Paper
Why Off-line Bushing Tests May Not Confirm Alarms from On-line Bushing Monitoring Systems
By Mark Tostrud, PE, Technology Officer, Dynamic Ratings. Presented at TechCon North America, Houston, 2017.
When an on-line monitor flags a degraded bushing but an off-line test doesn’t confirm it, engineers often assume the monitor gave a false alarm. Usually the difference comes from the test conditions. Off-line tests are run at about 10 kV and near ambient temperature, while an on-line monitor measures the bushing at full operating voltage and temperature. Contaminated bushings behave very differently under those two sets of conditions. In all three field cases in this paper, the bushings had passed a full off-line test shortly before the monitor flagged them, and follow-up testing confirmed the monitor was right.
Case studies
- First save at a manufacturing plant: After a transformer failure, the plant installed a used 1969 transformer with GE Type U bushings. The bushings passed commissioning tests with values close to nameplate. Three months later, a routine data download showed rising imbalance current caused by an increasing C1 power factor on the H3 bushing. The imbalance was still below the monitor’s 4% warning set point, but the customer tested the bushing during a scheduled outage. C1 power factor had risen from 0.29% to 0.47%, an increase of more than 60% in under three months. Hot collar tests were normal near the bottom of the bushing but showed high losses near the middle, indicating insulation contamination. The bushing was replaced.
- Second save on the same transformer: About seven months later, imbalance current rose again, this time from the H2 bushing. Because the monitor had already been proven right, the customer tested again and found C1 power factor had more than doubled, from 0.36% to 0.74%. That bushing was also replaced.
- East Coast utility: A maintenance worker on a routine inspection found a latched bushing monitor alarm on the station annunciator. It hadn’t been sent to SCADA, so there was no record of when it occurred. The data showed an imbalance current of 14.7%, driven by large changes in both the leakage current magnitude and the leakage current angle. The bushings had all tested healthy before the monitor was installed, but follow-up off-line testing found a significantly degraded bushing.
Temperature
- A healthy bushing shows almost no change in power factor with temperature. The change becomes more pronounced as a bushing ages.
- In the first case, the H3 bushing’s leakage current angle tracked top-oil temperature, with a slight lag caused by the bushing’s thermal time constant. An angle change of 0.41° corresponded to power factor rising from 0.29% to 1.00% as temperature went from 35 °C to 58 °C. The off-line confirmation test was run at 25 °C, which is one reason it found only 0.47%.
- Rather than temperature-correcting on-line data the way off-line instruments do, it is better to look for correlation between readings and top-oil temperature.
Moisture and other contaminants
- If moisture in the insulation exceeds about 1%, C1 tan delta can rise exponentially with temperature.
- Contaminants other than moisture change this relationship. Compounds from gaskets and other materials can leach into the bushing oil as it ages or runs hot, and even small amounts can change the oil’s power factor, and therefore the bushing’s.
- Most contaminants increase power factor as temperature rises, but some show no temperature correlation and some show a negative one.
Voltage
- In service, voltage stress on a bushing is often greater than temperature stress.
- A defective bushing was lab-tested under four conditions. At standard off-line conditions of 10 kV and 25 °C, its power factor was only slightly elevated and stable. At 70 kV and ambient temperature, it showed wide swings. At 70 kV and 70 °C, its power factor started about 10 times higher than normal and reached almost 20 times higher by the end of the test.
- Once the voltage and temperature stress are removed, you shouldn’t expect off-line power factor and capacitance values to match the on-line readings.
Contamination along the inner porcelain
- As bushing insulation and oil age, they form decay products, including colloids containing metal atoms. These semi-conductive deposits settle unevenly on the inside of the lower porcelain, wherever the electric field concentrates them.
- Depending on the location and pattern of the deposits, C1 tan delta can rise or fall, and the deposits can cause surface discharges and flashover.
- A 10 kV off-line test may not be enough to reveal this contamination. An on-line partial discharge monitor can detect it.
Conclusions and recommendations
- If an off-line test doesn’t confirm a degraded bushing flagged by an on-line monitor, investigate the off-line test conditions before dismissing the alarm.
- At a minimum, perform off-line tests at elevated temperature to improve the chance of confirming problems found on-line.
- Even then, because most contaminants also respond to test voltage, results at elevated temperature may still not match what the on-line monitor measures.
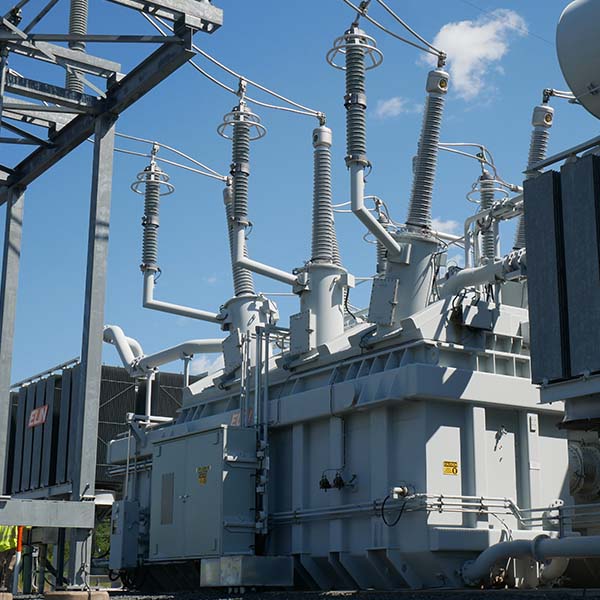
Dynamic Ratings' Transformer Bushing Monitors
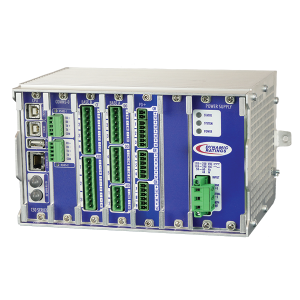
C50 Bushing Monitor
Dynamic Ratings’ C50 Bushing Monitor makes condition monitoring easy and affordable. The C50 looks at the condition of your bushings so that you can use real-time data to make decisions.

E3 Transformer Monitor
The E3 Transformer Monitor is a comprehensive, customizable solution for transformer asset management. The E3 monitors all key transformer components, consolidates data, manages communication to third party IEDs, and provides a single point of communication for alarms.

DTM Bushing Health Monitor
The DTM Bushing Health Monitor detects problems to prevent failure of transformer bushings, windings, and the bus connected to the transformer. The DTM Monitor configuration, historical data and detailed diagnostics provides an indication of the location, type and rate at which a problem is developing so that you can plan accordingly.