
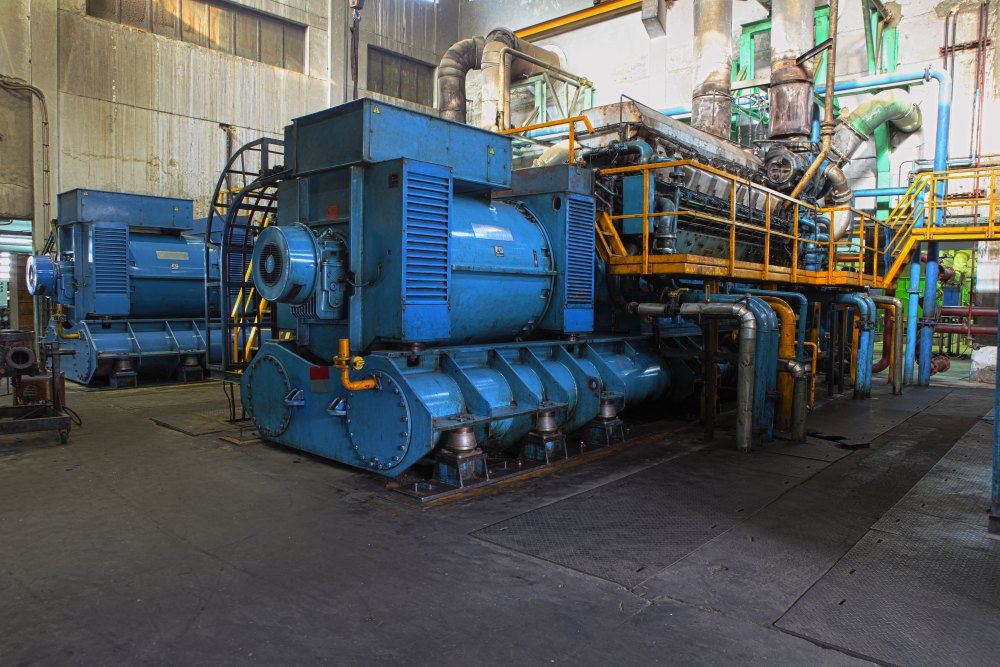
Somewhere on your plant floor right now, a stator winding could be quietly breaking down. Deep within its insulation, a small void is sparking — invisible to the eye, undetectable by a thermal camera, and easy to miss until the motor trips off unexpectedly. That spark has a name, partial discharge (PD).
Partial discharge is a localized electrical discharge that does not completely bridge the electrodes but instead erodes insulation from the inside out, like rust spreading through a hidden seam. For rotating equipment, that erosion is expensive to ignore. Failure statistics compiled by IEEE, EPRI, and IEC consistently point to one culprit. Stator winding insulation is responsible for more than 40% of motor and generator failures, and PD is the earliest measurable warning that insulation health is declining.
Monitoring PD on motors and generators is a different discipline than monitoring PD on transformers. Rotating machines add vibration, variable frequency drives, and tightly wound insulation systems that behave nothing like a static transformer winding, which means the sensors and interpretation methods have to be purpose-built.
If you’ve ever faced an unplanned motor outage or a scramble for spare parts, you already know how that story ends and how much you’d give for a warning sign earlier on. That warning sign is exactly what online PD monitoring provides, and it starts with understanding how to detect, measure, and act on it before insulation failure takes the decision out of your hands.
Offline vs. Online PD Monitoring: Which Lens Shows the Full Picture?
Offline PD testing is the traditional baseline for assessing insulation health. Technicians de-energize the equipment, apply a controlled high-voltage source, and measure the resulting discharge in a clean, low-noise test environment.
That control is also its limitation — offline testing can’t recreate full-service conditions like operating temperature, humidity, and mechanical load, so results only estimate how the equipment will behave once it’s back online. Because testing happens on a fixed interval, it also assumes operating stress hasn’t changed since the last outage, a riskier bet as maintenance intervals stretch to protect uptime.

Online PD monitoring flips that equation. By measuring discharge activity continuously while the motor or generator runs under real electrical, thermal, and mechanical stress, online monitoring captures anomalies that offline testing would never see — including fast-developing faults that can emerge in days or weeks rather than years, long before the next scheduled outage.
For asset managers balancing tighter O&M budgets against equipment that’s being run harder than ever, that real-time visibility is what turns condition-based maintenance from a policy into a practice, and it removes the guesswork of assuming tomorrow’s operating conditions will match last year’s test.
Decoding the Data: The Four PD Quantities That Matter
When a PD monitor captures discharge activity, it isn’t recording noise — it’s measuring four distinct quantities that together tell the story of a developing insulation defect.
PD magnitude describes the size of a single discharge, expressed in picocoulombs (charge) or millivolts (peak pulse height). As a void or defect grows, both values climb, making magnitude one of the first clues to defect size.
Pulse count tracks how many discharges occur over a given period. A small, early-stage void typically produces a low pulse count; a rising pulse count over time signals that the defect is growing and insulation is progressively degrading.
PD intensity, sometimes called PD power, combines magnitude and pulse count into a single energy-based metric. Essentially, how much destructive energy sits behind the discharge activity as a whole, rather than any single pulse.
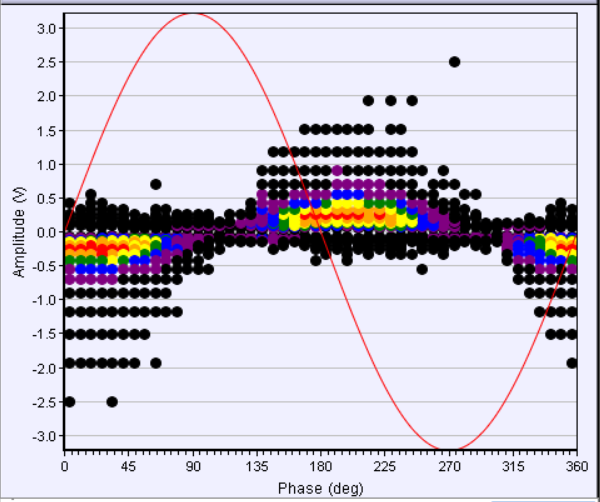
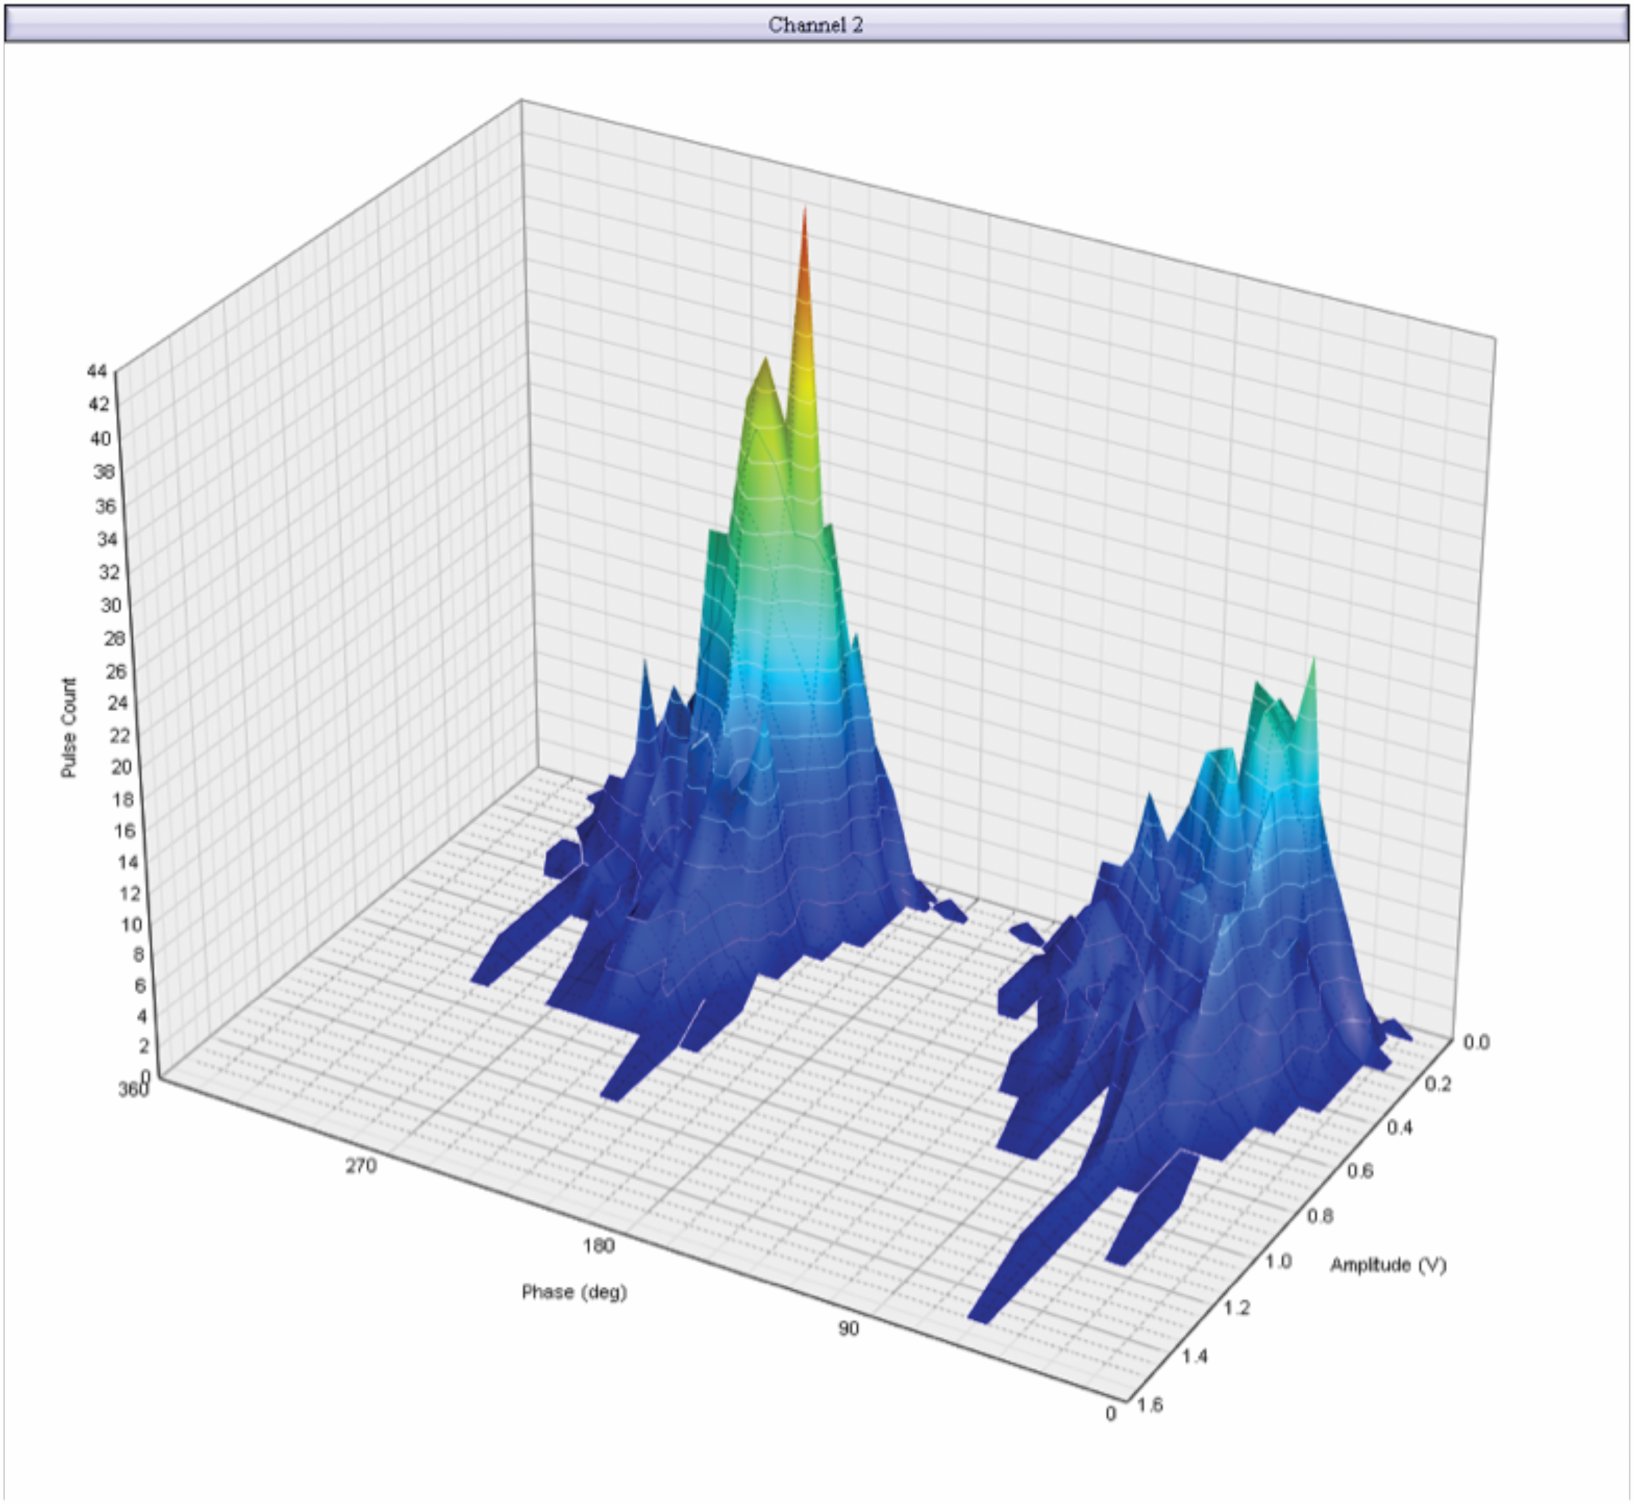
PD signature, captured through phase-resolved data, plots discharge activity against the voltage sine wave. The resulting pattern indicates where a defect is likely located within the insulation system, between the conductor and the first insulation layer, mid-insulation, or on the outer surface, based on whether the signature shows a negative, balanced, or positive pulse preference. Reference standards IEEE 1434 Annex A and IEC 60034-27-2 Annex C catalog known signature patterns to guide interpretation.
Together, these four PD quantities turn a raw electrical signal into an actionable diagnostic: how big the defect is, how fast it’s growing, how much energy is behind it, and roughly where it’s hiding.
Building a Sensitivity Strategy for the Whole Machine
Reading PD patterns is rarely as clean as a textbook example. Signal attenuation, sensor placement, multiple overlapping defect sources, and environmental factors like temperature and humidity can all distort a pattern. And the same defect can look different depending on how far it sits from the sensor, or how it interacts with noise elsewhere on the system.
That’s why IEEE 1434 and IEC 60034-27-2 both recommend layering sensor types rather than relying on any single one. Case studies bear this out: motors that appeared “healthiest” on coupling-capacitor data alone have turned out to be the most degraded once winding-embedded sensors were added to the picture — a misdiagnosis that a single sensor, on its own, would never have caught.
That’s precisely where online PD monitoring earns its value — not as a single measurement, but as a coordinated set of sensors working together to close the blind spots any one sensor would leave behind. The right combination of sensor types is what turns scattered, sometimes-contradictory signals into a clear, trustworthy picture of machine health.
From Sensors to Insight: The Monitoring Toolkit
The Rotating Machine Monitor (RMM) sits at the center of that strategy. The RMM is a continuous, online PD monitor built to pull every sensor’s data into one coherent picture rather than a pile of disconnected readings.
It supports up to 15 concurrent, highly sensitive input channels compatible with any brand of PD sensor, so it layers onto equipment that’s already instrumented instead of forcing a rip-and-replace install. Beyond raw PD detection, it applies advanced noise cancellation and correlates discharge activity with winding temperature, load, and humidity, giving asset managers the operating context needed to tell a real insulation defect apart from ordinary electrical noise.

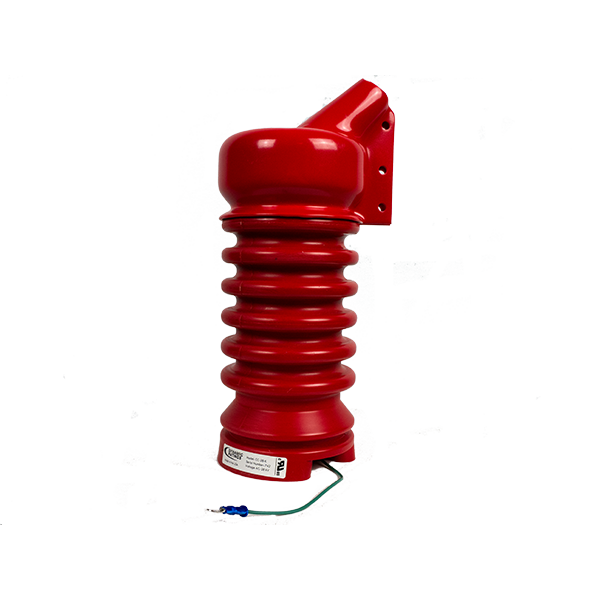
Feeding that picture are three complementary sensor types, each tuned to a different part of the machine. Coupling capacitors installed at the line terminals remain the industry-standard first line of detection, built with 775 V/mil dielectric strength, corona-free operation, and ±1pC PDEV sensitivity to catch discharge activity right where power enters the equipment.
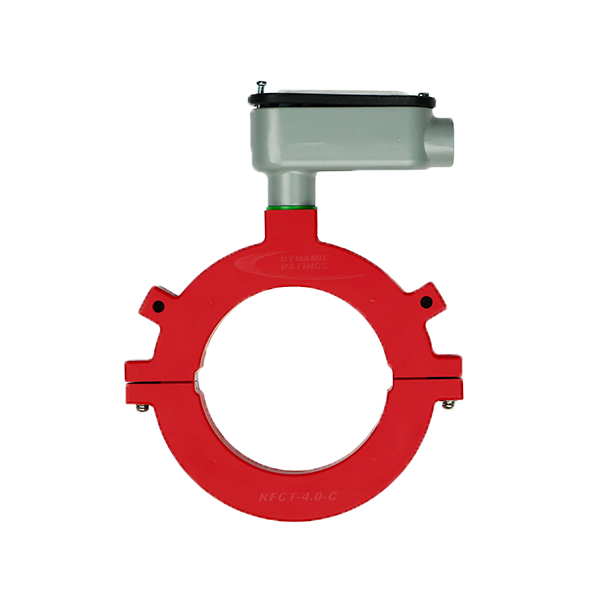
Radio Frequency Current Transformers (RFCT) extend that view by directionally sensing PD through the ground connection, offering a long “look” down the cable through a simple, non-invasive clamp-on install.
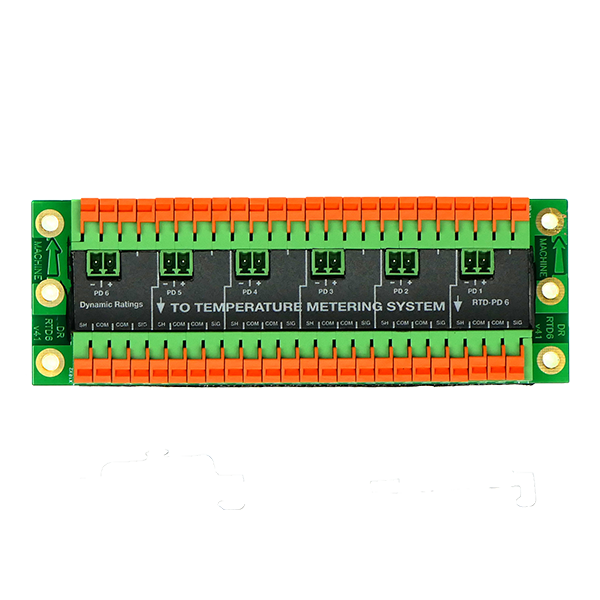
And RTD-PD sensor modules go a step further, turning a winding’s own embedded RTDs into RF antennas that pick up discharge activity deep inside the winding — territory line-side sensors alone can’t reach — without an outage to install. Paired together, the three sensors close the gaps any single one would leave behind, and the RMM turns their combined signals into the clear, trustworthy read on machine health that a coordinated PD strategy is built to deliver.
Unlocking Reliability, One Signal at a Time
Offline testing can only tell you what your equipment looked like on the day you tested it. Online PD monitoring tells you what’s happening right now — continuously, under the real electrical, thermal, and mechanical stress the equipment actually lives under, not a simulated snapshot once every few years. That difference is the whole game: trading a rear-view mirror for a live feed, and swapping hope for evidence, day after day.
That shift matters most in the moment you’ve likely already lived through: the unplanned trip, the scramble for a replacement motor, the difficult conversation about lost production. A coordinated online PD monitoring strategy is what lets you catch that story earlier — while it’s still a maintenance decision you get to make on your own schedule, not an emergency call at 2 a.m.
Want the deeper technical detail behind PD detection, interpretation, and sensor selection? This article is based on our webinar, Unlocking Reliability: Partial Discharge Monitoring for Motors and Generators, where you can watch the full session for the complete technical walkthrough. If an unplanned motor outage, a scramble for spare parts, or a difficult call to plant management isn’t a story you want to live through again, contact us today to build an online PD monitoring strategy for your motors and generators.

Author: Katie Panke, Dynamic Ratings