
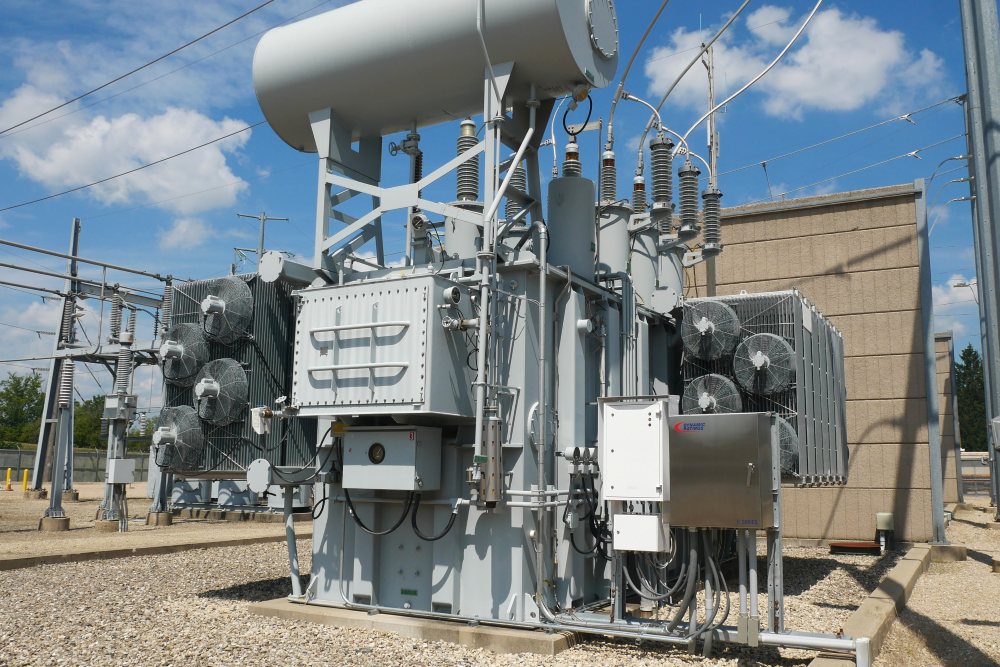
Every energized transformer produces hydrogen, methane, ethylene, acetylene, and carbon oxides as heat and electrical stress break down its oil and paper insulation. It could be the earliest fingerprint of a developing fault. Dissolved gas analysis (DGA) is how you tell the difference. It reads a transformer’s oil almost like a blood sample, catching trouble before it becomes an outage.
For decades, that meant a lab sample drawn once a quarter or once a year. Online DGA monitoring changes the math completely. Instead of an occasional snapshot, you get a stream of readings and trends continuously. That shift from periodic to continuous is what makes online monitoring different from traditional testing. It’s also where most alarm strategies fall apart, since they weren’t built to interpret that much data.
If you manage a fleet of monitored transformers, this next part will sound painfully familiar. A monitor goes in with good intentions, and within weeks your inbox is buried in alerts — most of them noise, none of them urgent. Engineers stop trusting the system, thresholds get raised or muted, and the one alert that actually mattered gets lost in the alarm fatigue. Static ppm limits were never built for this job.
Why Fixed Thresholds Fail and What a Baseline Fixes
Both IEC 60599:2022 and IEEE C57.104-2019 are explicit on this point. Gas concentration limits are guidance values, not pass/fail criteria. Yet in practice, many online systems still lean on static thresholds that ignore a unit’s design, age, and operating history. That mismatch produces two failure modes. Either a flood of nuisance alarms hits right after commissioning, or thresholds get set so high that a real fault sails through undetected.
Building a Transformer-Specific Baseline
The fix is a baseline-driven alarm strategy built around each transformer’s own behavior, not the fleet average. Start with 30–90 days of stable operating data, and exclude anything skewed by commissioning or oil-handling work. From that clean baseline, compute the median along with the 10th and 90th percentiles for each gas.
The 90th percentile isn’t a fault threshold. It’s simply the upper edge of that transformer’s normal operating scatter. A single reading above it is just a statistical outlier, worth a second look but not an alarm. A sustained exceedance over 7–14 days is what actually warrants attention.
Layering in Population Data
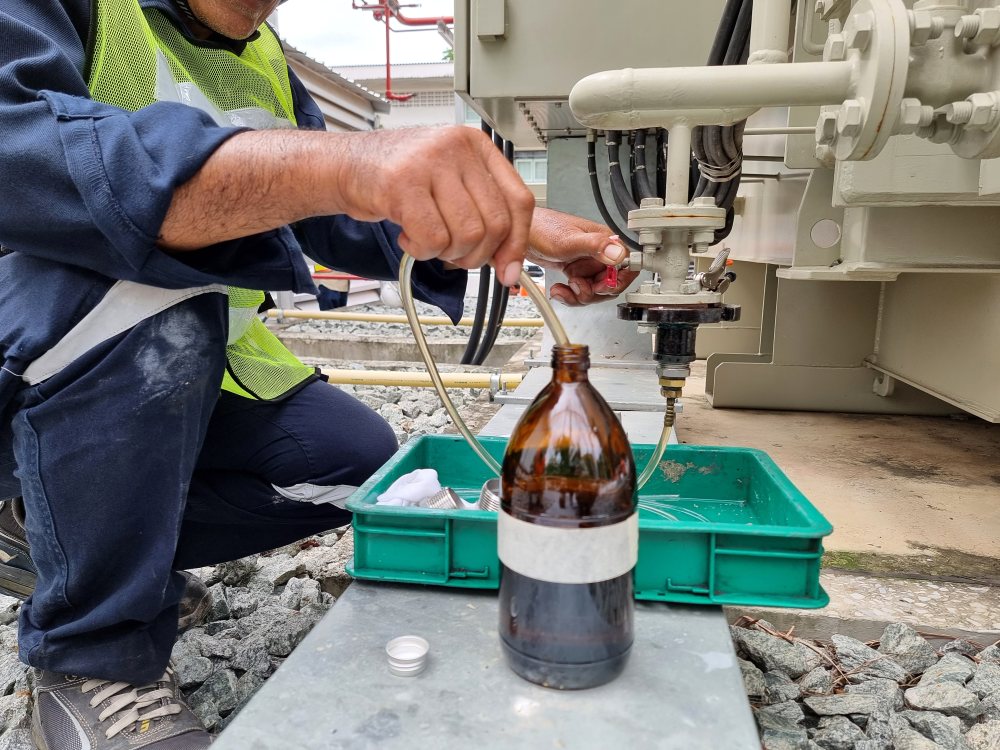
Layering that unit-specific baseline against population-based screening values from IEEE and CIGRE (drawn from over a million and 330,000 DGA samples, respectively) creates a graded escalation path — normal, elevated versus self, elevated versus self and population, alarm — instead of a binary trip.
It also explains several of the most common sources of alarm fatigue — stray gassing misread as fault activity, chronic CO/CO2 alarms that never clear, and Duval Triangle results applied before a trend is even confirmed. None of those are fixable with a tighter ppm number; they need context.
Why the Time Window Matters More Than the Threshold
Baselines and percentiles establish what counts as normal for a transformer, but normal levels only tell part of the story. Rate-of-change (ROC) is the metric that reveals whether a fault is stable, developing, or accelerating, and it’s arguably the most powerful discriminator in an online DGA program. But ROC is only as good as the window it’s calculated over, and most monitors default to the wrong one.
The Trouble With Short Windows
1-day and 7-day ROC feel responsive, but they’re dominated by non-fault influences — temperature-driven gas solubility, oil circulation, transient loading, and sensor noise. Rolling windows slide with each new reading, so the comparison drifts through different parts of the daily thermal cycle and the same short-lived spike can trip an alarm again and again.
Field data confirms it. A rolling 24-hour window can generate repeated false alarms even when the underlying gassing rate is stable, pushing operators toward suppressing alarms or distrusting the monitor, which is the opposite of what the system was installed to deliver.
Why 30 Days Gets It Right
A fixed 30-day (or longer) window, anchored to consistent daily boundaries rather than a rolling calculation, is the practical compromise IEEE and CIGRE data support. Transient effects average out, sensor noise is attenuated, and the resulting slope reflects genuine gas generation rather than momentary fluctuation.
IEEE 95th-percentile and CIGRE “typical” gassing rates converge closely once converted to a 30-day basis, reinforcing that window as the standard for condition classification, the tier where alarms should actually live.
Short-window ROC still has a role, just not this one. It’s useful for situational awareness and change detection on an operator’s real-time dashboard, not for triggering a formal alarm.
A Practical Alarm Philosophy for Online DGA
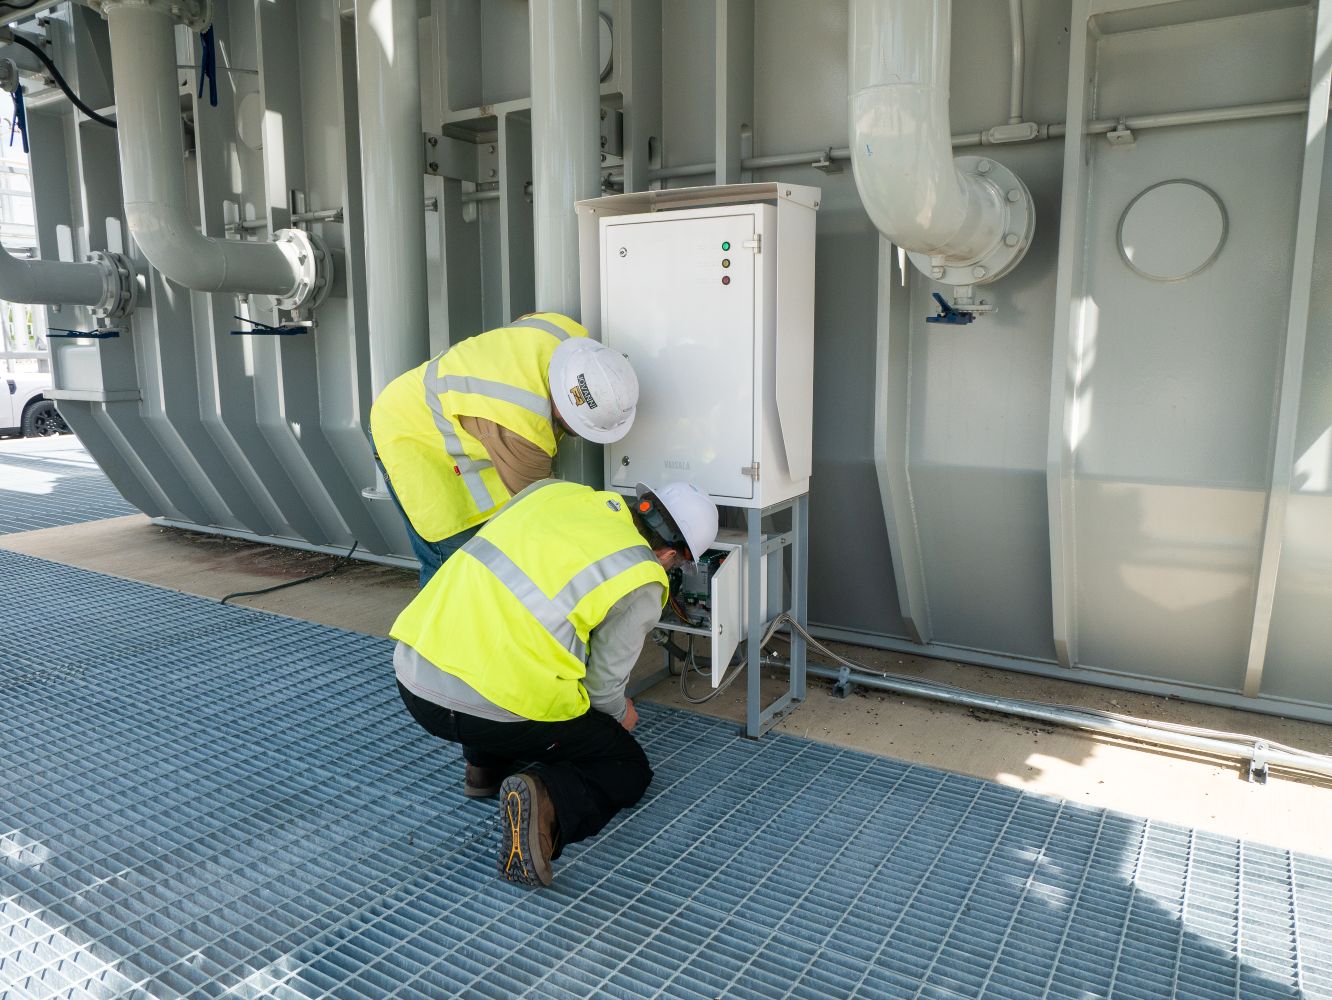
Baselines establish what’s normal. ROC shows how fast things are changing. Put together, they’re the foundation of a practical alarm philosophy that most fleets are still missing.
An effective online DGA alarm philosophy combines four elements:
- Transformer-specific baseline percentiles
- Population reference limits
- Sustained ROC criteria
- Confirmatory offline DGA.
The real question isn’t “has a limit been exceeded?” It’s “is gas behavior changing in a way that’s statistically and physically abnormal?”
That reframing does most of the work of cutting nuisance alarms while preserving sensitivity to genuine fault development. CO and CO2 should support condition-based maintenance rather than drive the alarm hierarchy, since they predominantly reflect oil oxidation and aging chemistry rather than active faults; Duval Triangles and Pentagons belong after an abnormal trend is confirmed, as diagnostic classification tools, not automatic early-warning triggers.
When a Transformer Is Under a Nursing Protocol
When a monitor is used to nurse a transformer through a controlled, degraded operating period, a standard alarm philosophy built for a healthy baseline will generate permanent, all-red alarms that teach operators to ignore the system.
Nursing mode instead redefines the baseline against the current elevated gas levels, switches to ROC-focused alarming, retains full sensitivity for C2H2 and C2H4 as the clearest signs of new arcing or thermal activity, and mandates confirmatory offline DGA on a fixed schedule with documented escalation criteria for when the case moves to a forced or planned outage.

From Pilot to Fleet
Scaling this beyond a single transformer means documenting it. That includes:
- Verifying each monitor’s accuracy
- Establishing a unit-specific noise floor
- Defining a consistent 30–90 day baseline period
- Recalculating percentiles annually or biannually,
- synchronizing fleet timestamps so central analytics carry the fixed-window ROC calculation.
The emerging best practice splits the work by design. Online DGA monitors focus on high-quality, real-time measurement, while fleet analytics platforms handle baseline management and interpretation. This lets a transformer fleet management program scale without overwhelming operators.
Unlocking Reliability, One Alarm at a Time
Put those pieces together, the baselines, ROC, and a philosophy built to scale across a fleet, and the payoff becomes clear. The real strength of online DGA monitoring was never about catching every ppm change. It’s about giving asset managers a live, continuous read on transformer health instead of a snapshot taken once a year. Done right, a baseline-driven, trend-focused alarm strategy delivers on that promise.
Fewer false alarms. Faster trust. Genuine early warning of the faults that matter. Because it finally stops treating every transformer as an average of the population and starts treating it as itself.
That shift matters most in the moment when the alarm sounds that nobody quite trusts, the scramble to decide whether it’s real, and the nagging sense that somewhere in the noise a genuine fault might be hiding.
A well-designed alarm philosophy is what turns that scramble into a scheduled decision instead of an emergency one — and what makes predictive maintenance a practice instead of a slogan.
If you want the full technical detail behind baselines, percentiles, ROC calculation, and fleet deployment, this article draws on our two-part technical series, Beyond Fixed Limits: Baseline-Driven, Trend-Focused Online DGA Alarm Strategy — Part I and Part II. Read both for the complete methodology, tables, and worked examples behind the strategy summarized here.
Ready to move your own fleet beyond fixed limits? Contact us today, and our team can help you build a baseline-driven online DGA monitoring strategy tailored to your transformers.
Author: Katie Panke, Dynamic Ratings